
How to Calculate Standard Deviation: A Worked Example

To calculate standard deviation, find the mean, measure each value's distance from it, square those distances, average the squares with the right denominator, and take the square root. The result is in the same units as the original data. The key choice is whether your list is the whole population or a sample of a larger group.
This guide works through both formulas with the same seven values, shows every deviation and squared deviation, and explains how to check the result without rounding too early. You can use the method with a short class exercise, a quality-control sample, or a small descriptive data set; for formal analysis, follow the definition and procedure specified for your study. The worked example also shows how to calculate standard deviation from the raw values and where the two denominators change the answer.
The short answer
Population: σ = √[Σ(x − μ)² ÷ N]
Sample: s = √[Σ(x − x̄)² ÷ (n − 1)]
Both formulas use squared distances from the mean. Divide by N for a complete population; divide by n − 1 for the common sample estimate of population variance. Then take the non-negative square root.
What standard deviation measures
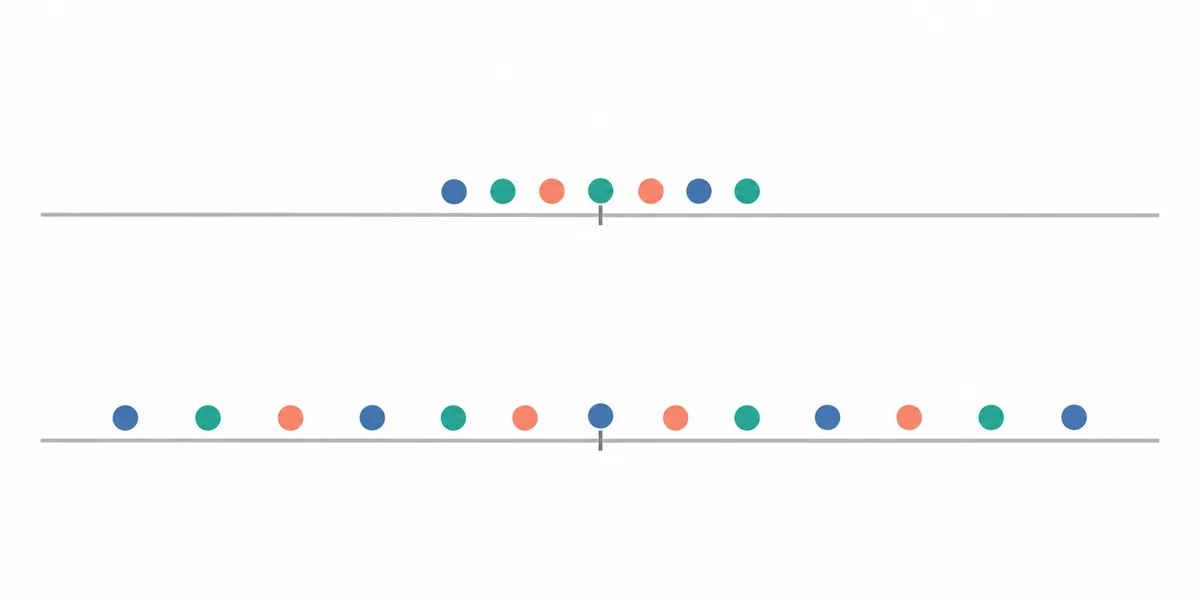
Standard deviation is a measure of spread around the arithmetic mean. It is built from every observation, so it responds to both the number of values and how far those values are from the center. A small standard deviation means the values are relatively close to the mean; a larger one means they are more dispersed.
It is not the same as the range. The range uses only the smallest and largest observations, while standard deviation uses all of them. Two groups can share a mean but have different spread, and two groups can share a range while having different patterns between their endpoints. Squaring the deviations also gives unusually distant values more influence, so inspect outliers rather than assuming that a large answer is a calculation error.
Choose the population or sample formula
Use the population standard deviation when the values include every member of the group you intend to describe. For example, if a file contains the scores of every student in one defined class and your question is only about that class, the population denominator is the class size, N.
Use the sample standard deviation when the observed values are a sample used to estimate a larger population. Its variance calculation divides the sum of squared deviations by n − 1, a correction commonly called Bessel's correction. This makes the sample variance an unbiased estimator of population variance under the usual independent random-sampling assumptions. It does not mean the two formulas are interchangeable, or that a convenience sample is automatically representative.
Decide from the question and data collection, not just from how many rows you see. A short list may be a complete finite group, while a long list may still be a sample. If instructions, a reporting standard, or a study protocol specifies a formula, follow it and state which one you used.
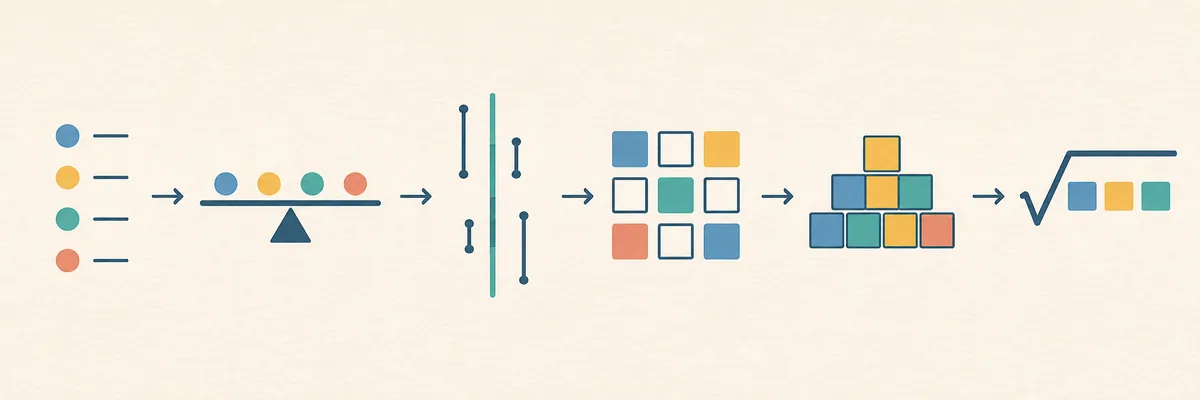
How to Calculate Standard Deviation by Hand in Six Steps
These steps show how to calculate standard deviation consistently: keep the values, units, and denominator choice visible as you work.
- Write down the observations. Confirm that each value represents the same kind of measurement and uses the same units.
- Calculate the mean. Add the values and divide by the number of observations.
- Find each deviation. Subtract the mean from each value. Positive and negative differences show direction, but their signs will not remain after squaring.
- Square every deviation. This avoids cancellation between values above and below the mean and weights larger distances more heavily.
- Add and divide. Sum the squared deviations, then divide by N for a population or by n − 1 for a sample.
- Take the square root. This returns the answer to the original measurement scale.
A complete worked example with seven values
Suppose the data are 4, 8, 6, 5, 3, 7, 9. First add them: 4 + 8 + 6 + 5 + 3 + 7 + 9 = 42. There are seven values, so the mean is 42 ÷ 7 = 6. Use the table to see how to calculate standard deviation once, then reuse the same arithmetic for both formula choices.
Subtract 6 from each value, square the result, and keep the full set in view:
| Value (x) | Deviation (x − 6) | Squared deviation |
|---|---|---|
| 4 | −2 | 4 |
| 8 | 2 | 4 |
| 6 | 0 | 0 |
| 5 | −1 | 1 |
| 3 | −3 | 9 |
| 7 | 1 | 1 |
| 9 | 3 | 9 |
| Total | 0 | 28 |
The deviations add to zero, as expected when they are measured from the mean. The squared deviations add to 28. If these seven numbers are the entire population, divide by 7: the population variance is 28 ÷ 7 = 4, and the population standard deviation is √4 = 2.
If the seven values are a sample, divide by 7 − 1 = 6: the sample variance is 28 ÷ 6 ≈ 4.6667, and the sample standard deviation is √(28 ÷ 6) ≈ 2.1602. The sample answer is larger because it uses a smaller denominator. Keep the unrounded value through the square root, then round only to the precision your task requires.
How to interpret a standard deviation
The answer uses the same unit as the data. If measurements are in centimeters, a standard deviation of 2 means two centimeters, not two squared centimeters. Variance is measured in squared units; taking its square root returns to the original scale.
Interpret the number alongside the mean, the sample size, the shape of the distribution, and how the values were collected. A standard deviation of 2 may be small for distances measured in kilometers and large for values that usually differ by fractions of a centimeter. Comparing spread is most useful when the variables and measurement methods are comparable.
For a roughly bell-shaped, approximately normal distribution, about 68% of observations fall within one standard deviation of the mean and about 95% within two. Those are model-based approximations, not a universal rule for every data set. Skewed distributions, repeated values, small samples, and outliers can make that shortcut misleading. A standard deviation by itself does not describe the full distribution or prove that observations are typical.
Common mistakes to avoid
- Choosing the wrong denominator: population uses N; the common sample variance estimate uses n − 1. Write down why the data count as a population or sample.
- Skipping the square: adding raw deviations gives zero around the mean. Standard deviation uses squared deviations before averaging.
- Stopping at variance: variance is the mean squared distance; standard deviation is the square root of variance.
- Mixing units or groups: convert measurements first and do not combine separate populations unless that matches the question.
- Rounding too early: early rounding changes the squared deviations and can shift the final result. Keep extra digits until the last step.
- Ignoring unusual values: because distances are squared, an outlier can strongly affect the result. Verify it against the source instead of deleting it solely to make the spread smaller.
Calculate standard deviation in Excel
For a spreadsheet range, =STDEV.S(A1:A7) requests a sample standard deviation, while =STDEV.P(A1:A7) requests a population standard deviation. Replace the range with the cells that contain your observations. Check that the selected cells include the intended values and that the sample or population choice matches your question; a function cannot determine the study design for you.
Spreadsheet output is a useful arithmetic check, but keep a written record of the data, formula choice, units, and rounding rule. If you are learning how to calculate standard deviation, compare the spreadsheet result with the squared-deviation total from the hand calculation.
Frequently asked questions
What is standard deviation?
Standard deviation describes the typical distance of data values from their mean. A smaller value indicates a tighter cluster, while a larger value indicates more spread.
Should I use the sample or population formula?
Use the population formula when your list is the complete group you want to describe. Use the sample formula with n − 1 when the observations are a sample used to estimate a larger group.
Can standard deviation be negative?
No. Variance is a sum of squared distances divided by a positive denominator, and standard deviation is its non-negative square root. It is zero when every value is identical.
How is standard deviation different from standard error?
Standard deviation describes spread among individual observations. Standard error describes the uncertainty of a sample statistic, such as a sample mean, and depends on both spread and sample size.
Can I calculate standard deviation in Excel?
Yes. STDEV.S(range) calculates a sample standard deviation and STDEV.P(range) calculates a population standard deviation. Choose the function that matches what the data represent.
Further reading
- Khan Academy: Calculating standard deviation step by step explains the mean, squared distances, and square-root sequence.
- JMP: Standard deviation discusses spread and its relationship to variance.
To check a list with an on-page calculation, see the site's standard deviation calculator. Its interface is in Japanese; use the same population or sample convention shown above.
In summary
To calculate standard deviation, find the mean, square each value's distance from it, divide the squared-distance total by the population size or by one less than the sample size, and take the square root. For the values 4, 8, 6, 5, 3, 7, 9, the population standard deviation is 2 and the sample standard deviation is about 2.1602. State which formula you used, keep the original units, and round only at the end.